1. WHAT IS A HISTOGRAM?
A histogram is a type of chart that groups numeric data into bins, displaying the bins as segmented bars. Histogram might look like a bar chart, but it group number into ranges, representing by segment bars, and there's no gap between bars. The height of each bar shows how many fall into each range.

2. WHEN TO USE HISTOGRAMS?

Histograms are recommended when you :
Have continuous measurements and want to understand the distribution of values and look for output.
Summarize large data sets graphically.
Analyze the data distribution (especially when determining whether the output is distributed approximately normally)
Conduct a segmentation analysis (might be helpful in decision-making)
3. STEP BY STEP GUIDANCE WITH Data Insider:
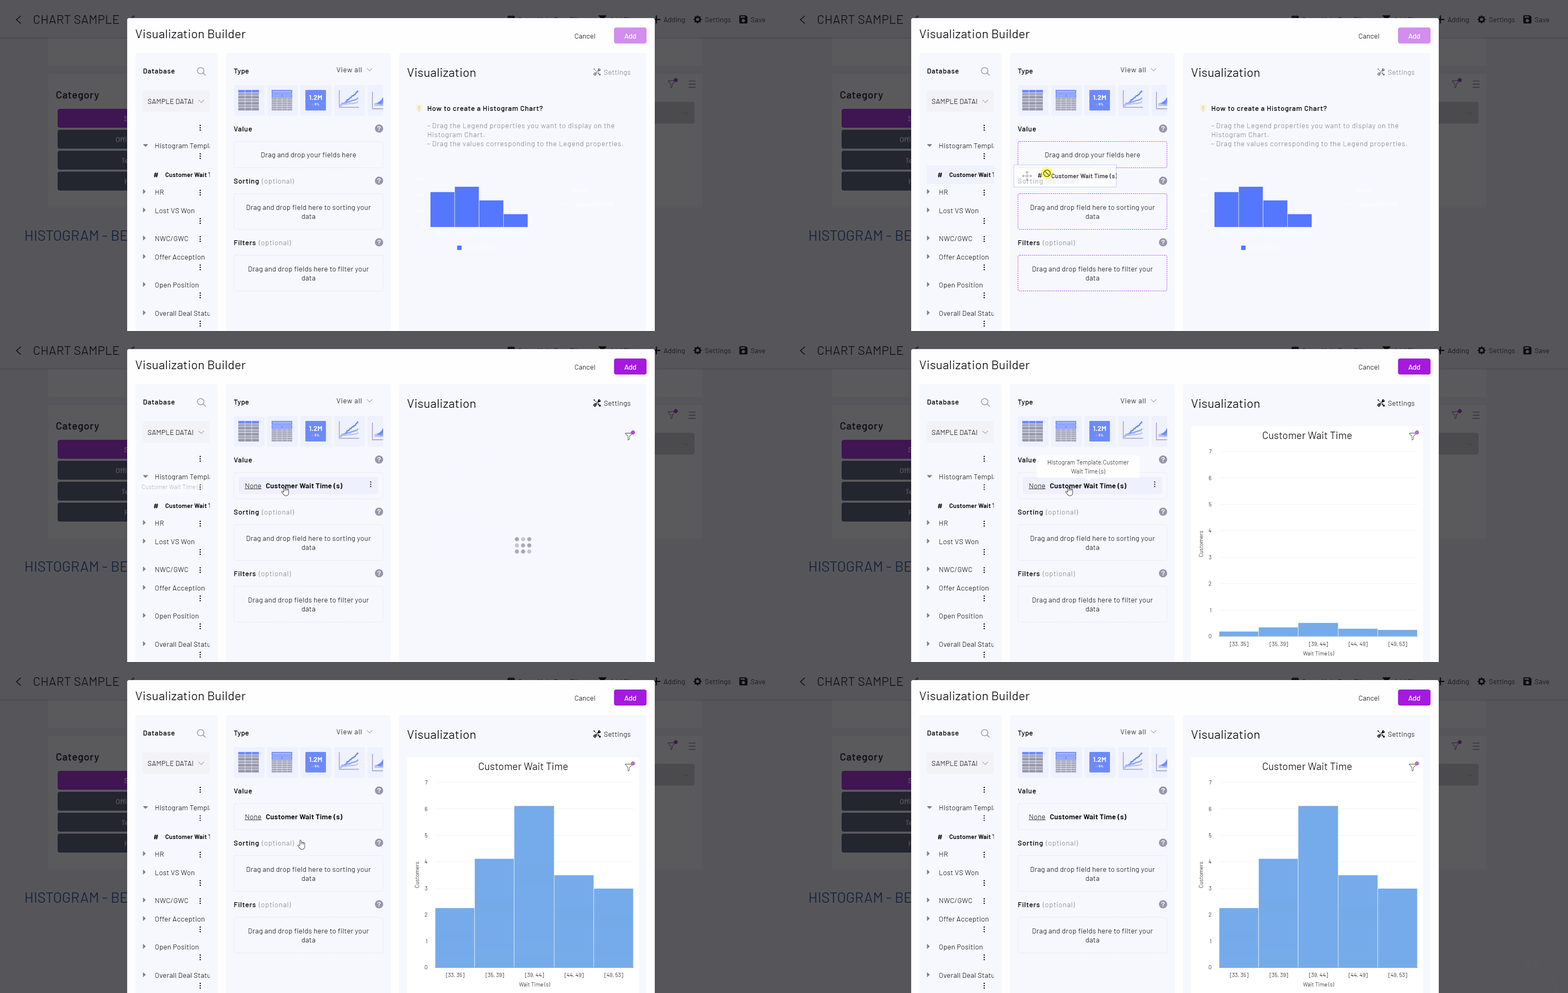
Desired chart : A histogram that shows the customer wait time distribution.
Step 1. Drag Customer Wait Time (s) to Value
